Debugging C++ in Visual Studio - ▶️ Playlist
Core Concepts
1. Breakpoints (2:36)
- Purpose: Pause program execution at specific lines to inspect state.
- Setup:
- Click left gutter OR press
F9on the desired line.int main() { int a = 8; // ← Set breakpoint here a++; }
- Click left gutter OR press
- Run with Debugger:
F5to start debugging.
2. Stepping Through Code (6:28)
| Action | Shortcut | Behavior |
|——————-|————–|———————————————–|
| Step Into | F11 | Enter function calls (e.g., Log()). |
| Step Over | F10 | Execute current line without entering functions.|
| Step Out | Shift+F11 | Exit current function and return to caller. |
Example Workflow:
- Breakpoint hits at
int a = 8; F10to execute line →abecomes8.F10again →a++increments to9.
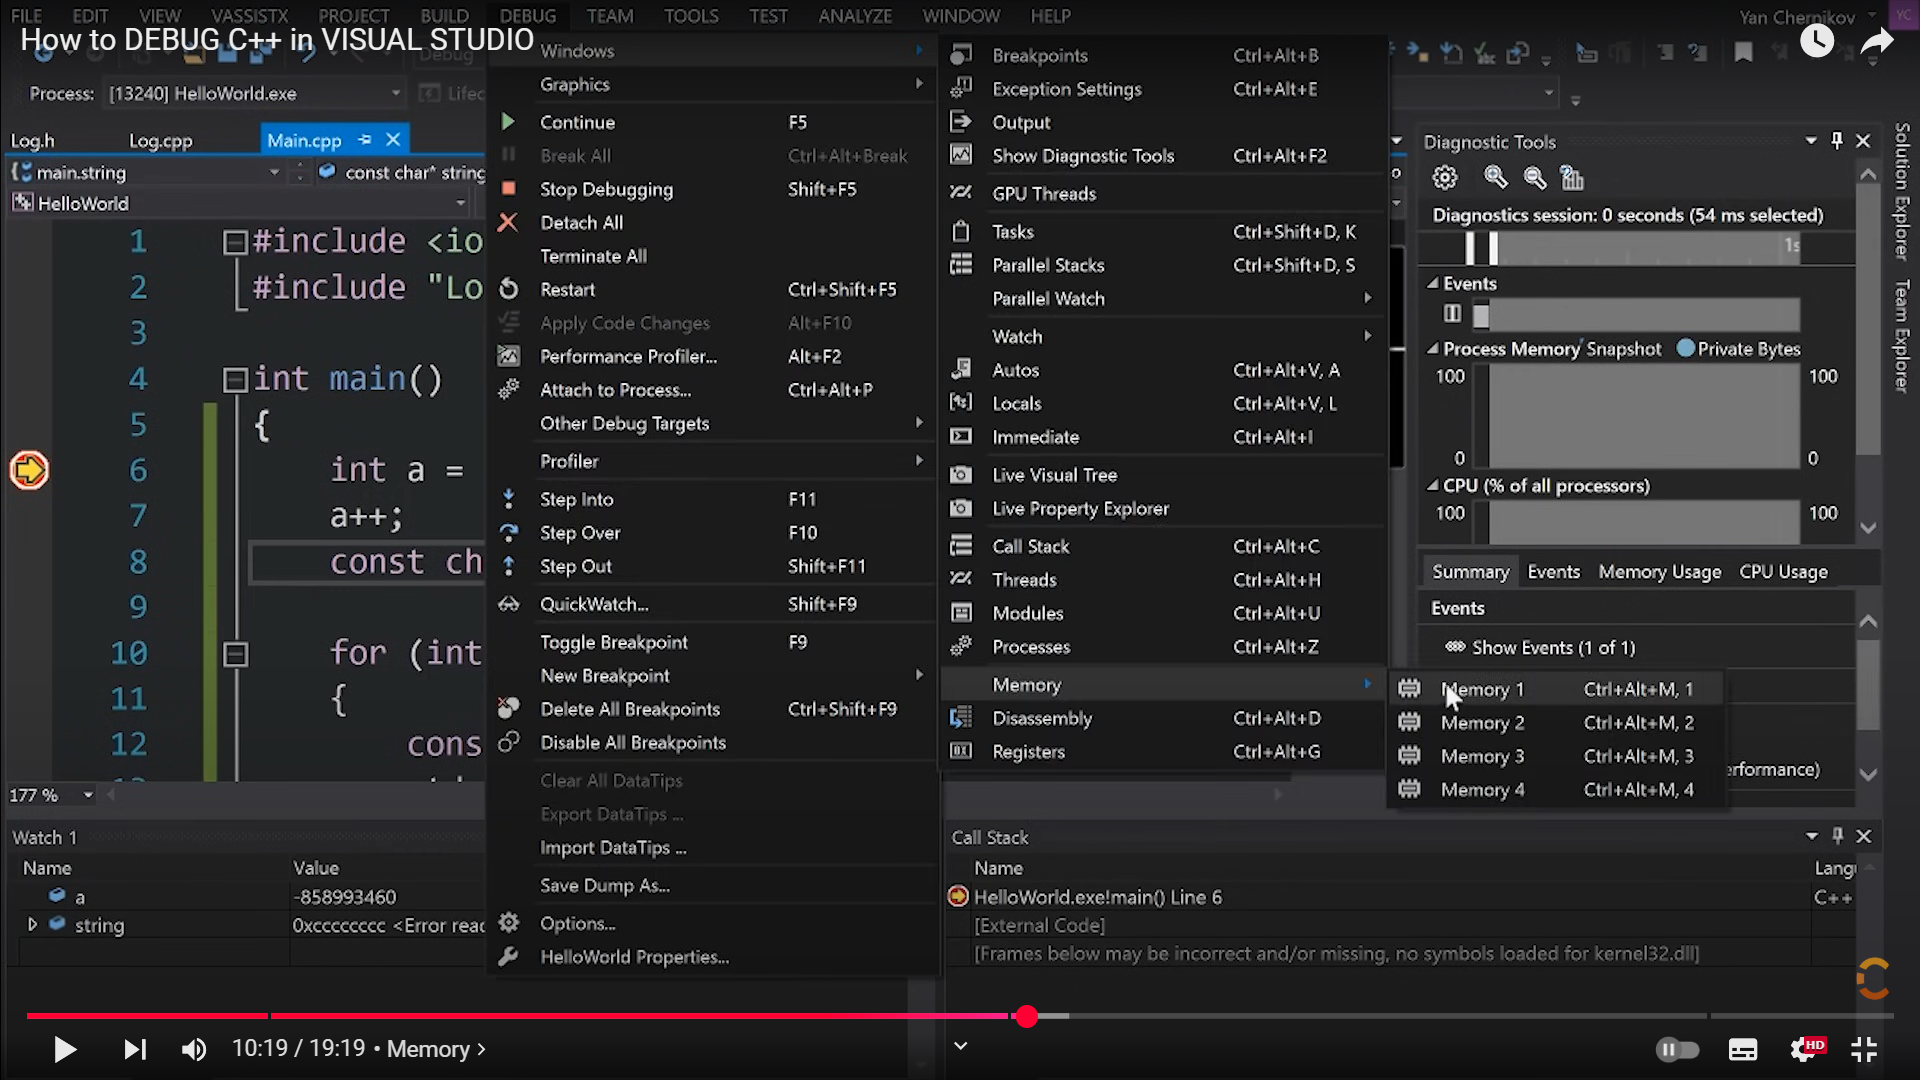
3. Memory Inspection (9:55)
- View Variables:
- Autos/Locals Window: Auto-displays variables in scope.
- Watch Window: Manually track variables (e.g.,
a,&afor address).const char* string = "Hello"; // Watch: `string` shows address, `*string` shows 'H'
- Memory View:
Debug → Windows → Memory → Memory 1.- Enter variable address (e.g.,
&a) to view raw hex/ASCII data.
Debugger Windows
1. Autos/Locals
- Autos: Shows variables relevant to the current line.
- Locals: Lists all variables in the current scope.
2. Watch
- Track custom variables/expressions:
a       // Value of `a`
&a      // Memory address of `a`
*string // First character of `string`
3. Memory
-
View raw program memory:
- Memory View Example:
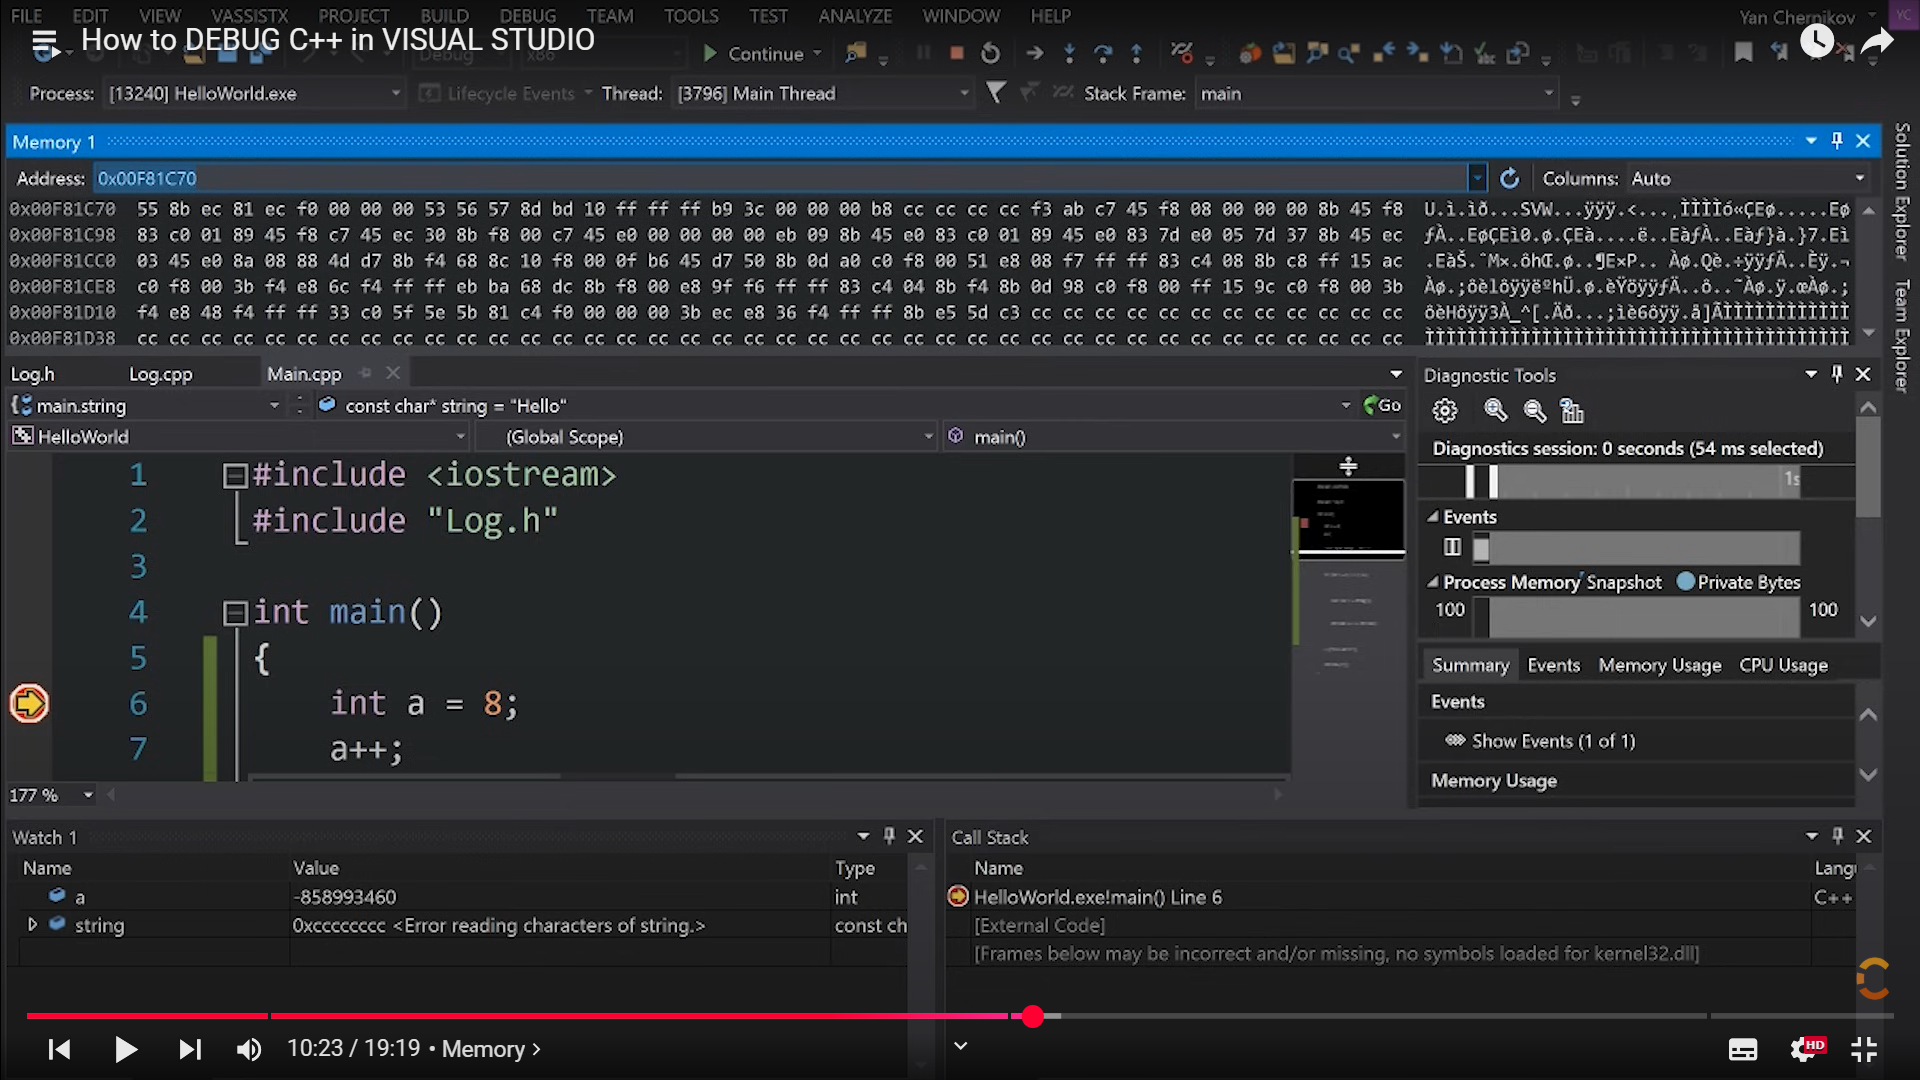
- Hex Format:
CC= uninitialized stack memory (debug mode only).
Common Debugging Scenarios
1. Uninitialized Variables (10:40)
- Symptom: Garbage values (e.g.,
a = -858993460in debug mode). - Fix: Initialize variables before use.
int a = 0; // ✅ Good
int b;     // ❌ Bad (contains CC bytes)
2. Memory Corruption (14:12)
- Sign: Unexpected values in memory/watch window.
- Debug:
- Set breakpoint before/after suspected code.
- Compare memory states.
Pro Tips
- Always Use Debug Mode:
- Compiler adds safety checks (e.g.,
CCfiller for uninitialized memory). - Release mode optimizations may break breakpoints.
- Compiler adds safety checks (e.g.,
- Hex Display:
- Right-click Watch window → Hexadecimal Display for raw values.
- Conditional Breakpoints:
- Right-click breakpoint → Conditions (e.g., break when
a > 5).
- Right-click breakpoint → Conditions (e.g., break when
Video Reference Cheat Sheet
Key Principle:
The debugger lets you freeze time to inspect variables/memory. Combine breakpoints and stepping to isolate bugs efficiently. 🐞🔍